
What Are Candlestick Charts?
Stock investing can be daunting, as I have said many times. But, this is one of the best ways to make your money grow. There are many ways to invest in stocks, and a number of combinations to use. I also advise to invest in markets you know that meet the key metrics. After you have that down, now you just need to look at the charts to see if it is a good time to enter the market. Here was find out how do you read candlestick charts. Below I talk about reading candlesticks and make it work for you.
Reading Candlesticks: The Candlestick
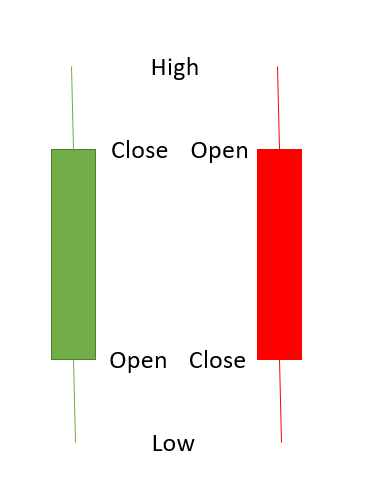
The candlestick itself may be a foreign term, especially if you’re used to seeing a line chart. A candlestick is a more advanced measure of a stock price’s activity over a certain period of time. It tracks the open, close, high, and low price over the time period. For example, if the chart is showing a 1 day candle, the single candle will tell you the open and close prices in the body. The wick of the candle, on the top and bottom of the body, show the high and low prices for that day. Changing the candle intervals changes the time frame, but not the concept. A green candle represents a positive candle, and the red candle being a negative candle. The open and closed are reversed based on the direction of the market.
Reading Candlesticks: Patterns
Traders have many patterns that they follow that could potential give indications. Typically, it is how the candle and the surrounding candles compare to one another. For example, if the green candles are decreasing in size and eventually become red candles, this would indicate a bearish movement (downward direction). Inversely, if there were many red candles decreasing in size and eventually followed by a green candle, this would indicate a bullish movement (upward direction).
Candlesticks Pattern: Hammer
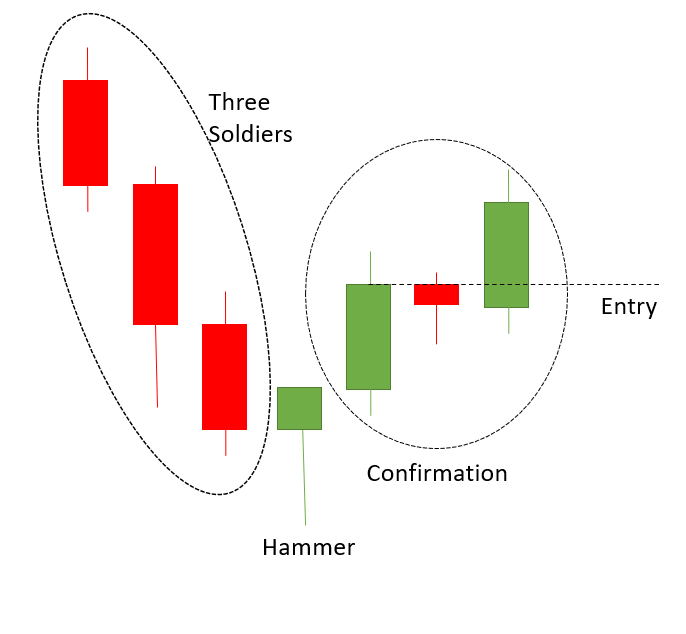
The hammer is named because of its resemblance to a hammer. The candle has no top wick. Also, the body of the candle is much smaller than the bottom wick. This can signal the bottom of a downward trend.
The hammer can also be found upside down. This is commonly referred to as in the inverted hammer. This typically shows there was significant selling pressure, but not so much to make the price go below opening.
Candlesticks Pattern: Three Soldiers
This is when you have three of the same color bars in a row. It signals a continuation. Red soldiers are a bearish continuation, while green is a bullish continuation. This is an area of caution because it could attract bears who short sell, causing the price to drop.
Candlesticks Pattern: Confirmations
The confirmation typically comes after you are seeing a bottom or top of a trend. The hammer is an indicator for this. If you’re trying to time an entry in, you may see a green bar after three red soldiers and think it’s time to jump in. Hold on one second, you need a confirmation. A common confirmation is a green bar, followed by a small red bar, then a large green bar. At times, there may be two small bars between the two green bars. The entry point would be where the second green bar reaches the top of the red bar.
Reading Candlesticks: Trendlines
Trendlines are boundary type lines that you draw between multiple peaks or valleys to see trends of tops or bottoms that the stock will likely go. They can be broken down into two types of lines, support and resistance lines.
Support Lines
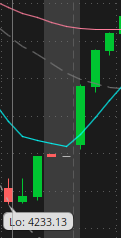
The support line is the connection of the lows. This will is a trend that the stock hopefully will bounce off of and head in the positive direction. Volume is a good indication if the stock will bounce off the trend line. If the buying volume increases and the selling volume decreases, the stock will likely bounce up.
Resistance Lines
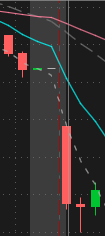
This line is the opposite of the support line. It is drawn between the highs in the stock price. This line is where short selling investors will hedge against the stock in the short term. Of course, the volume has the a similar effect, only in the opposite direction. Once the resistance line is broken, it acts as a new line of support.
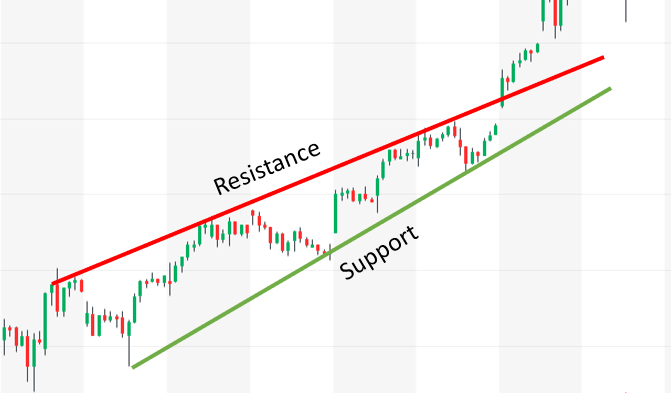
Many support and resistance lines will seem to converge. In these cone set ups, the stock may bounce between the two lines until the price breaks through, either through the resistance or support lines. If the support line is broken, the stock will likely take a dip. In the image above, the resistance line is broken, creating a new trend. As you can see, there was a confirmation after the resistance line was broken. This would have been a strong indication to buy the stock on its way up.
Reading Candlesticks
One thing is for certain, the market does what it wants. But, you can use indicators to give a better guess as to which direction the market is going. Each candle is a set interval. You can have the represent a day, an hour, even a minute. Day traders use the minute candles to capitalize on inner day swings, while the long-term investor uses them to time good entry and exit points in the market. You should use this information with stock indicators to maximize your results.
Disclaimer
Once again, I am not a financial advisor. These tips are some things I have validated with my own personal experiences. If you feel you need more personal advice, please consult a professional financial advisor. Dont forget to check out the Book List for published authors on this topic!


