
Stock Indicators Help Success
First, I want to start off by saying these are the stock indicators that I personally use. There are numerous indicators that you can use that may fit your strategy better. However, I will show you how using these indicators will help you time your market entry. These can be used looking at long term investing or if you wanted to dabble in day trading or short term (under 1 year) trading. Before I look at using these indicators, I first need to choose a strategy, personally I use a combination. Next, choose a company using key metrics, then time it with indicators.
Stock Indicator: Relative Strength Index
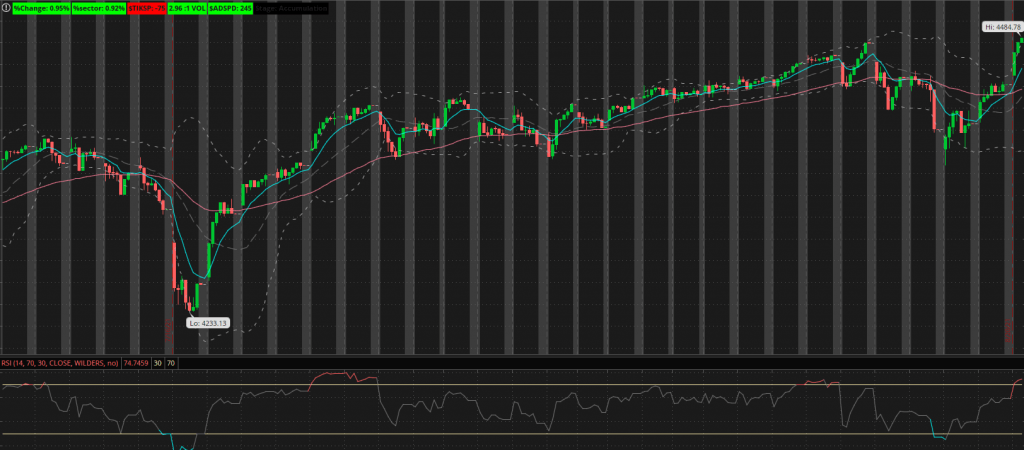
The first indicator I look at is the Relative Strength Index (RSI). The RSI will perform an analysis on the stock, given the time period, to determine if the stock is over bought or over sold. Readings go between 0 and 100, but the over sold region is under 30 and the over bought region is over 70. Of course, you can customize the indicator however you want. But, the over bought or sold regions may tell you if the stock is going to go up soon or down. Looking at the below chart of the S&P 500, you can see at which points the stock was over bought (red) or over sold (blue). At the red areas, it can be considered a bearish divergence. Meanwhile, the blue areas signal a bullish divergence.
Stock Indicator: Moving Average Convergence Divergence
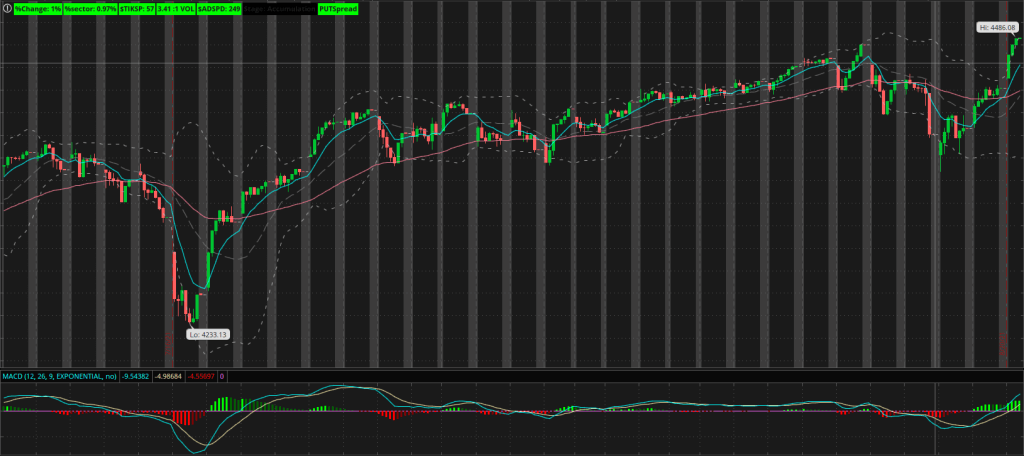
The next stock indicator that I use is the Moving Average Convergence Divergence (MACD). This indication shows the relationship between two moving averages, the 26 month, and the 12 month exponential moving averages. When the MACD (blue) crosses the signal line (grey), it can trigger a bullish or bearish trend. As the lines converge on each other, you can see the price movement weakening. The further away the two are, me more extreme movements. The green and red bars are a histogram that tells you how far away the two lines are from one another. A large histogram signifies a a strong momentum. In summary, the MACD is used to show changes in direction and the intensity of the momentum.
Stock Indicator: Commodity Channel Index
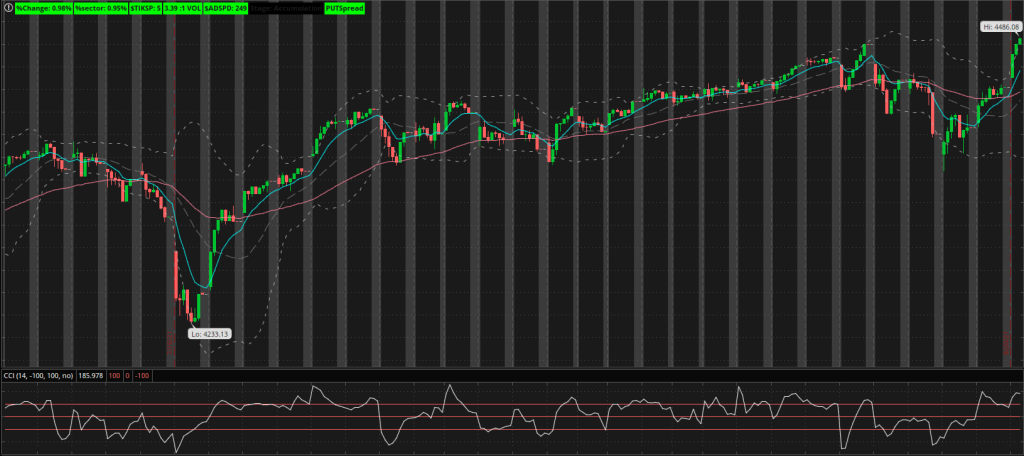
The third stock indicator I use is the Commodity Channel Index (CCI). Contrary to its name, the CCI does not deal only with commodities, but also stocks. Similar looking to the RSI, the CCI follows trends. It compares the current price of the stock to the average over a set time. When it crosses the center line (the average price), it may signal a buy or sell order. Also, the three lines (-100, 0, 100) give you an indication on where the current price is sitting compared to the average. Therefore, if this stock has a history of staying relatively flat, then buying at low points can be beneficial.
Confirmations
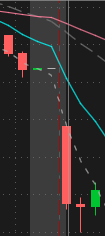
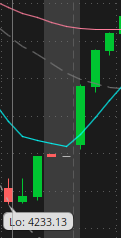
One thing that should be noted are bar indicators called confirmations. These help reduce the false triggers that are seen with each stock indicator. These confirmations are shown next. The red bar, followed by a small green bar, followed by a large red bar is a sell confirmation. The green bar, followed by a small red bar, followed by a large green bar is a buy confirmation.
Combining Stock Indicators
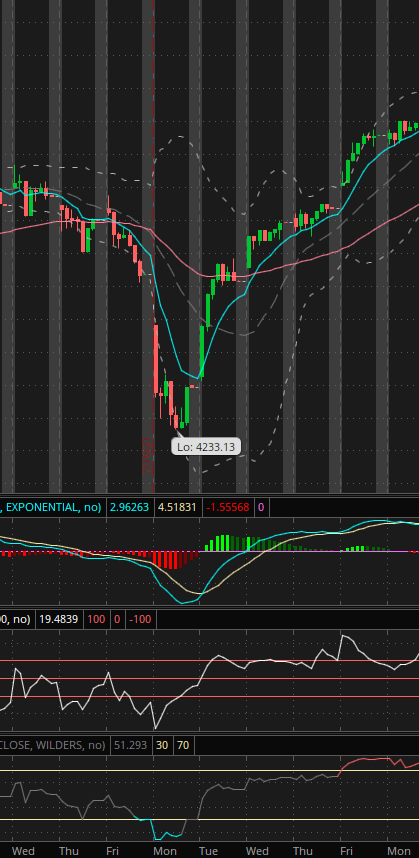
Each of these stock indicators has its own merits in detecting signals and trends. In unison, you can see a situation where you would buy or sell. Now, let’s look at the following chart. The three indicators from the top to the bottom are the MACD, CCI, and RSI. As the stock moves downward, none of the three indicators gave a sell trigger. The low day shows a huge downward momentum and the stock was overbought, cheaper than the average price. Now, Looking at the moment the MACD crosses lines, we look at the other two indicators. The RSI is no longer in the overbought area and the CCI is crossing the average price line. Also, the graph is showing a buy confirmation. This is a waterfall of triggers that would say to buy in now. If you would have bought at the top of that large candle, you would be sitting on a 5% increase today. Not too bad for a month.
Disclaimer
Once again, I am not a financial advisor. These tips are some things I have validated with my own personal experiences. If you feel you need more personal advice, please consult a professional financial advisor.

