
Supply and Demand Concepts
Supply and Demand are some basic economic concepts. Understanding them will help you with choosing your side income, or paving a pathway for your current business. While conceptually, they’re easy to understand, putting them into legit quantitative equations is more difficult. Try and understand your market from this prospective and you’ll position yourself appropriately to be successful.
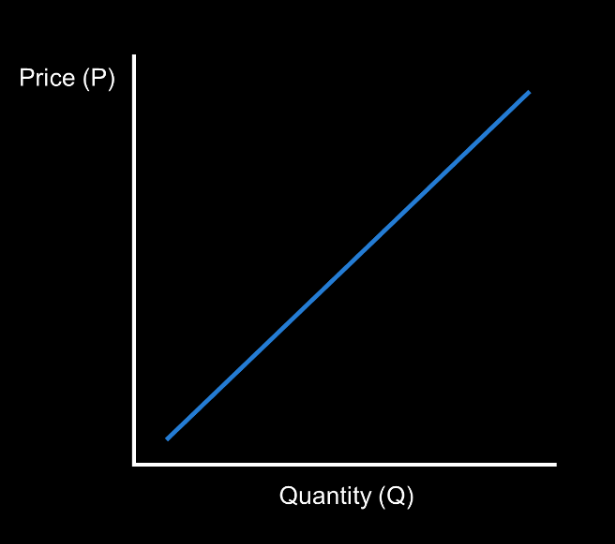
Supply
The law of supply is the marginal cost for the supplier to make a certain quantity of units. The higher the price of the product, the more of the product the producer will be made to be sold on the market. For example, if you are making CDs, if they only sell for $1 and production cost is $0.90, you may only make a small amount. But, if those same CDs were are selling for $10 profit, you’re going to make more until you’re no longer making a profit. On a larger scale, the law is the same, the more profit something makes for the producer, the more producers are going to create to put on the market. Therefore, the supply curve is proportional.
The producer surplus is difference in the cost of the item and the cost to produce the item. That means the area between the price and the cost line up to the intersection point.
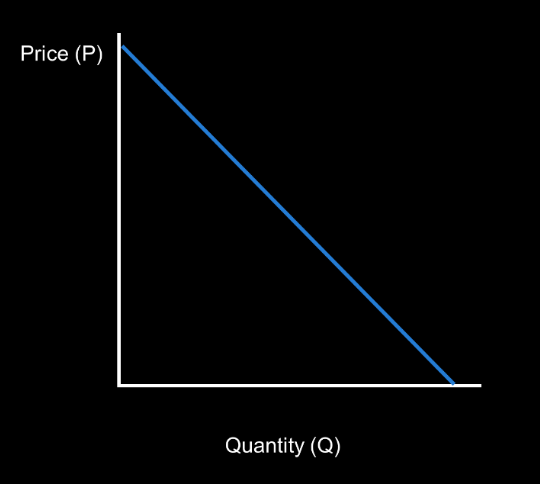
Demand
Demand is also pretty simple, but works in the opposite manner. But, it is much easier to understand, in my opinion. The demand curve results from the rarity of an item. If there are few items on the market, the price someone is willing to pay is high. On the other hand, if the market is plentiful, then the price someone is willing to pay is low. For example, think of sneakers. A standard Nike shoe may go for $50. They’re plentiful, so the market isn’t hurting for pairs. But, a limited edition Air Jordan can go for $500 because their is so few and people are willing to pay for their own pair. If they were as abundant, they too may only go for $50. Because of this principle, the demand curve is inversely proportional.
But, the technical definition of the demand curve is how many units would someone be willing to pay for a certain quantity. In this case, the example is slices of pizza. If you’re hungry, you’re willing to pay a certain amount for the first slice. But, as you eat, you’re less willing to pay as much for the next slice, until that point where you’re full and you’re not willing to buy another slice. This is where the demand curve crosses the x-axis.
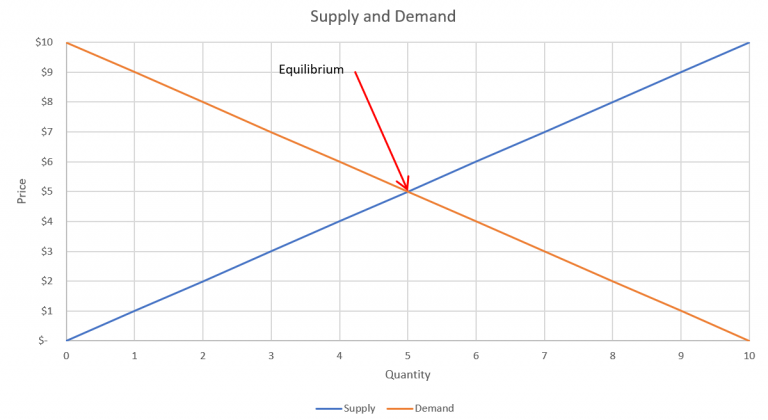
Supply and Demand Equilibrium
The supply and demand curve graph is just an overlay of the two curves. One is saying that suppliers are willing to produce certain amount of units if the price is at a certain amount. Meanwhile, the consumer is willing to pay a certain amount depending on the quantity in the market. The intersection of those two is called the equilibrium point. At this point, it is not worth it for the producers to produce more and not worth the buyers to buy more. In some markets, the price is set and the equilibrium is not met.
Supply and Demand In Real Life
The struggle for me when I was first learning about supply and demand was associating it to real life. As an engineer, I would see a curve and want to know exactly how the equation was formed. Unfortunately, most of the curves and diagrams are conceptual. But, we can use them to illustrate the real world situations to understand shifts in pricing.
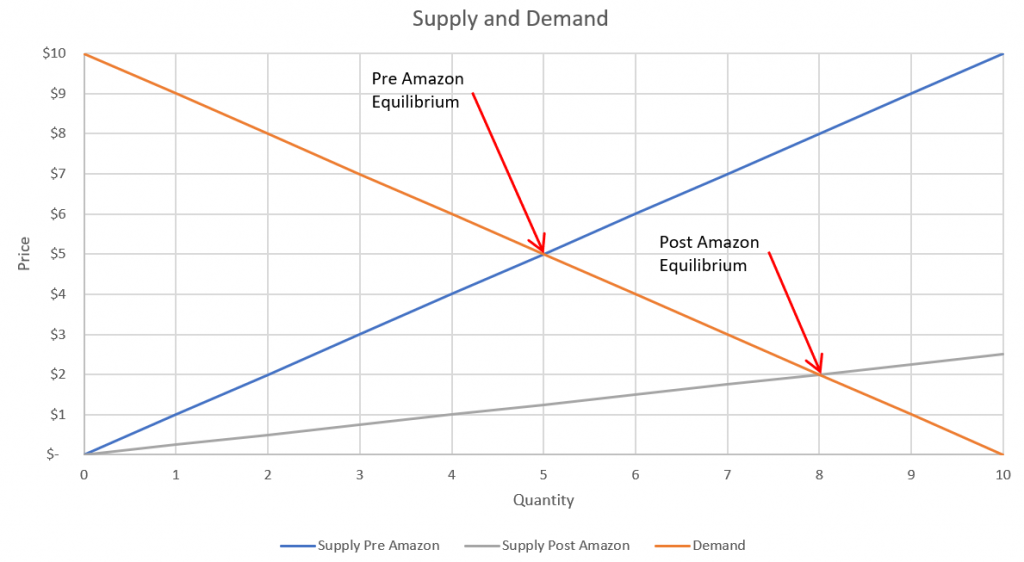
Let’s take HDMI cables for example and how Amazon changed the supply curve and the equilibrium point. Prior to Amazon, where did someone go to purchase an HDMI cable? Probably Bestbuy or Target. The basic HDMI cable is $25. But, where else could the consumer go? Plus, the cost to the producer increased because of profit sharing with the warehouse stores. The producer may only keep 40% of the sales price. They also had to keep warehouse levels up to make sure they can always fulfill orders from these companies. This made a relatively steep supply curve, thus causing a higher equilibrium price.
Then along came Amazon. Unlike these big retailers, Amazon did not need to charge the producers large overhead to cover expenses. Additionally, the companies were not expected to hold a large amount of inventory on stock out of fear of being dropped by the retailer. This lower production cost meant the producers could sell their product for cheaper to the end consumer. The result was a flatter supply curve. Since the demand for these cables is pretty consistent and the price is now cheaper, the equilibrium price decreased.
Find The Right Market
Now that you understand supply and demand, you can understand what current markets are like and whether or not it’s right for you. If the industry is showing a very low producer surplus, perhaps it’s not a great market to hop into. Find something with a high demand and a high equilibrium point to optimize your profits.
Disclaimer
Once again, I am not a financial advisor. These tips are some things I have validated with my own personal experiences. If you feel you need more personal advice, please consult a professional financial advisor. Dont forget to check out the Book List for published authors on this topic!

